Campus pond assignment
Myles Abbate and Shashi Vivarelli site #5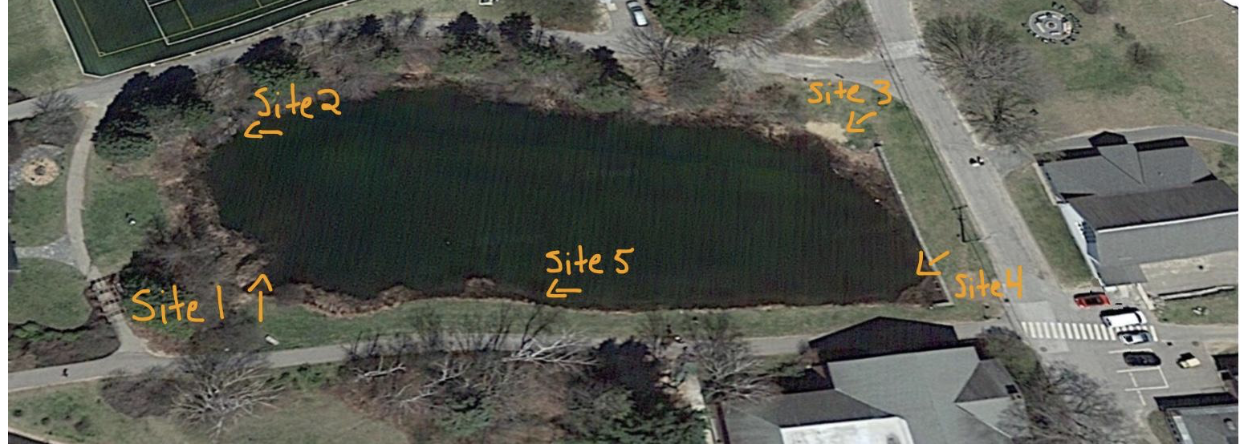
Screenshot from google earth
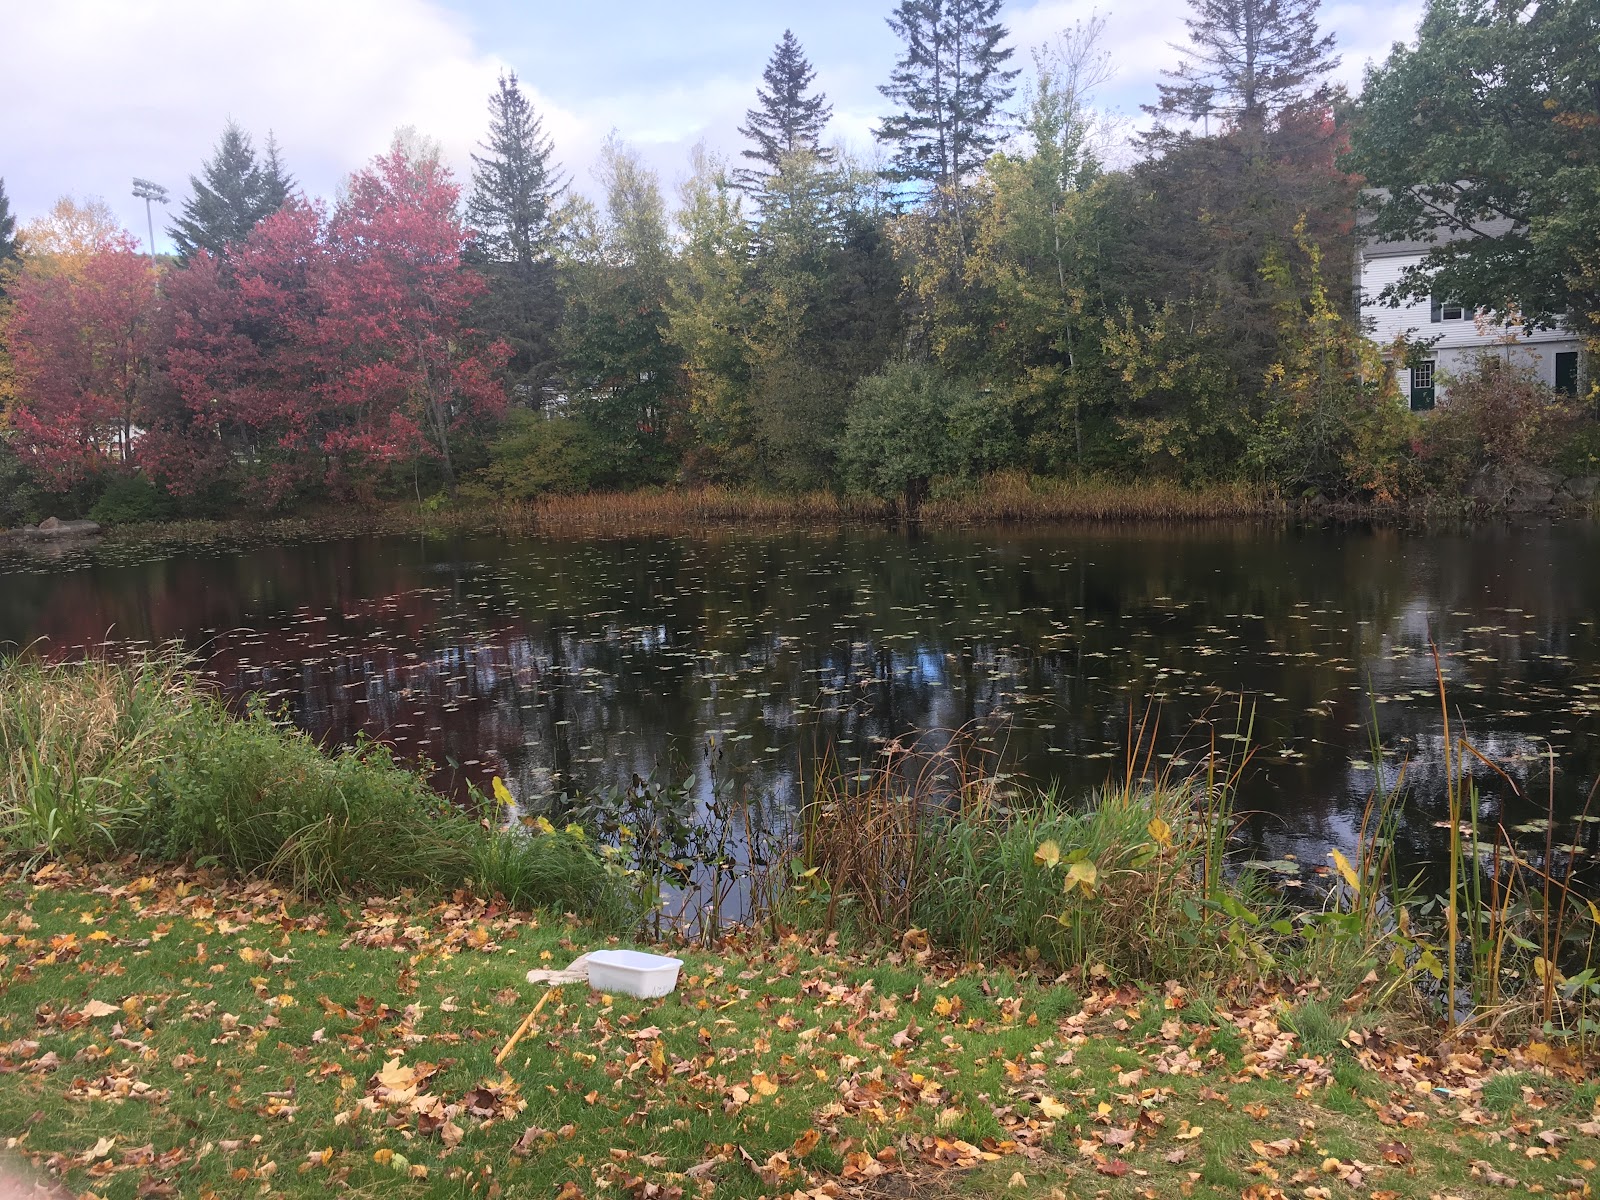
Photo credit Myles Abbate
General Purpose: The purpose of this was to test the health of the Proctor pond and see the effect it has on the ecosystem of Proctor. If we couldn’t find anything biodiversity in the pond then that will conclude that the pond is unhealthy. As a class we were sampling biotic and abiotic things and help us determine the health and Biodiversity that is in the pond. Over the years of testing the pond, there has been changes that surround the pond like the turf fields, the freeze and amount of rainfall that has occurred the past couple of years. The water is being tested by us and we are analyzing it and seeing if there is differences or similarities between the past years. From the data we found and compared the pond is slightly declining throughout the years and I believe the pond will increase in the years coming.
Materials:
All Sites used:
-One pole net either wooden or metal
-Up to two spoons, one with holes one without holes
-Eye droppers either small tip or large tip
-A compact magnifying glass
-One large tub to obtain samples
-One smaller tub with dividers to place organisms in
-Smart Phone to take pictures of organisms found and to take notes.
Methods: To begin the testing we left the classroom and went to gather our materials from outside (material listed above). After getting them Shashi and I headed to our site #5. Other than catching species, we did some test on the pond that included PH, dissolved oxygen, turbidity, water temperature, air temperatures, nitrates, weather, and time of day. One of the days we were testing Alan didn’t have to get to us because he had to travel to the far site #6. Over the course of the three days, Shashi and I would scoop above the surface and under the surface to collect these biotic and abiotic samples. When we collected the things from the pond, we poured it out from the net and begin to analyze what we caught. We would count up what we caught and over the next couple of days in class we gather the information into the Biodiversity index.

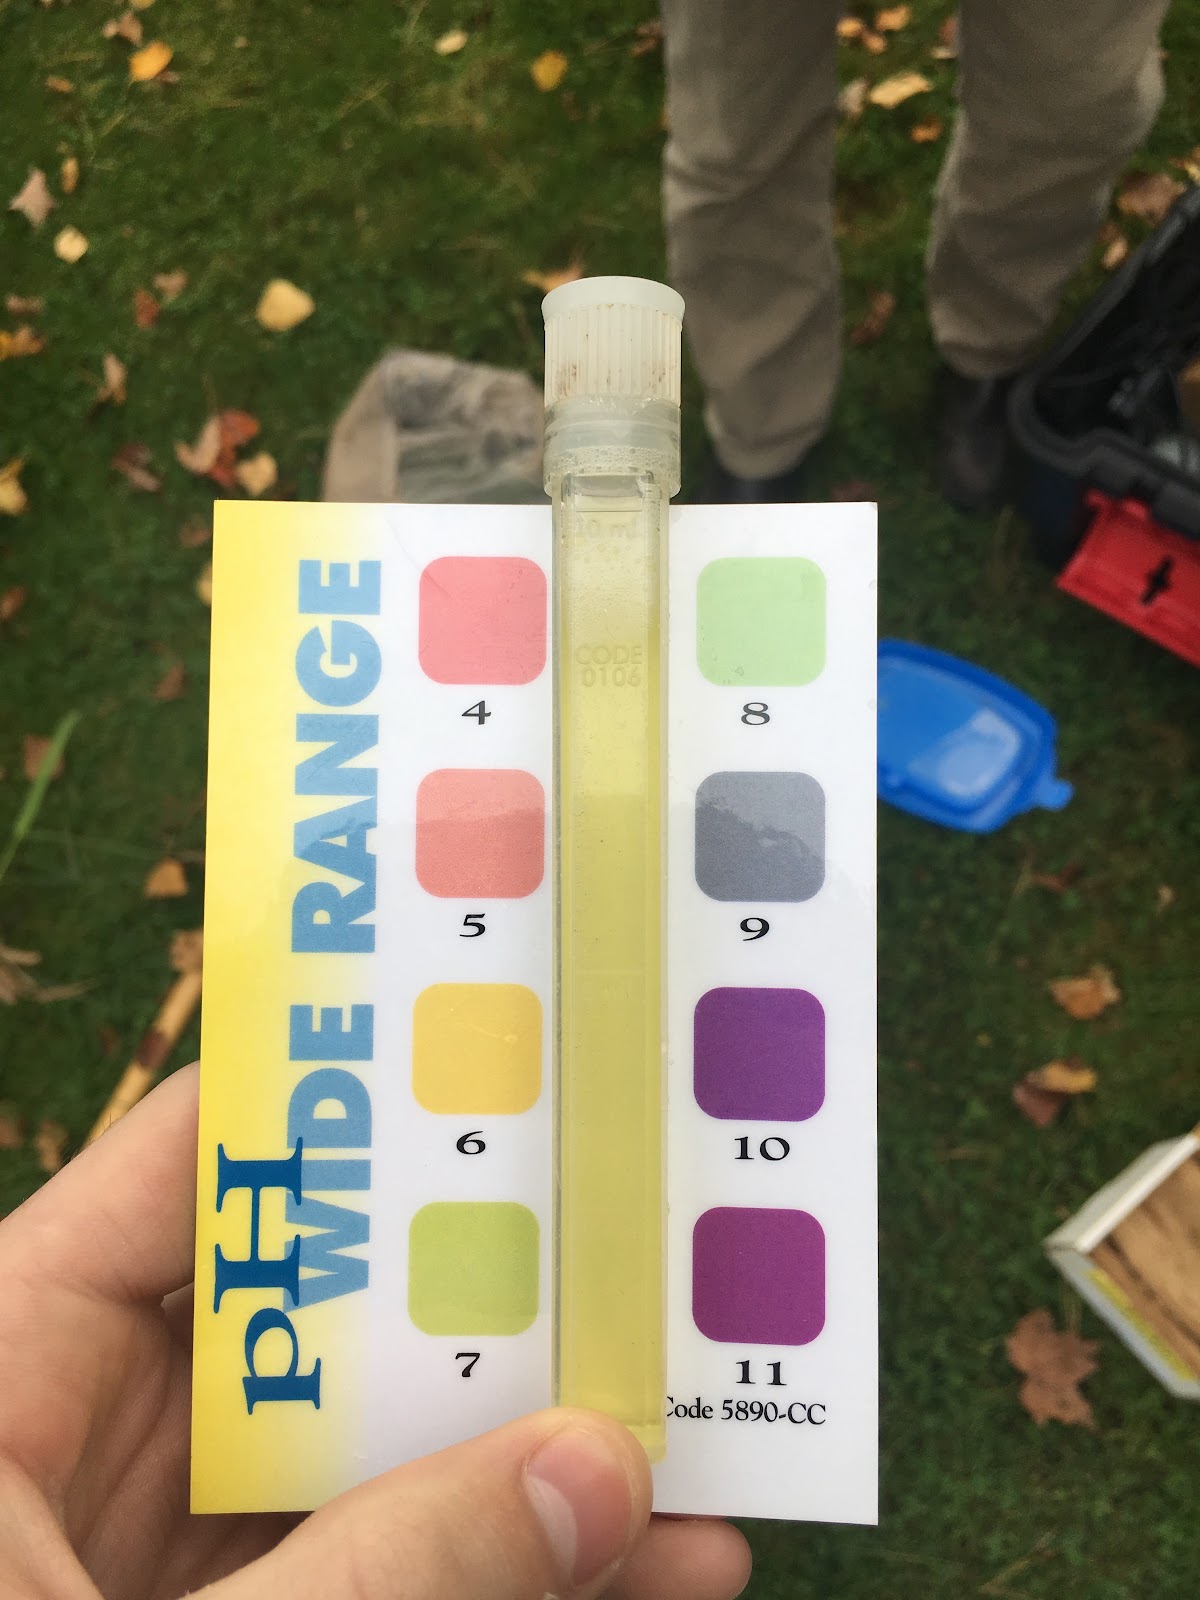
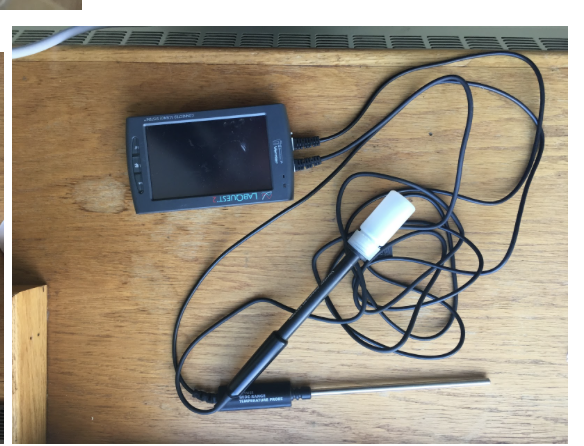
Photo credit Shashi Vivarelli Photo credit Myles Abbate Photo credit Betsy

Photo credit Mo
General Narrative: Shashi and I were located at site #5. The three days that we tested were October 13th,16th, and 17th. This site was located outside of Shirley Hall. We would test for biotic and abiotic things. The weather was different each day were sampling. On the 13th it was sunny and partly cloudy, on the 16th it was overcast, high winds and cold, and on the 17th it was sunny, high winds and cold. Each of these days we would sample the abiotic (PH, dissolved oxygen, turbidity, water temperature, air temperatures,and nitrates) so that we could gets the results from the pond and then collect the biotic samples. Every day we learned about the samples and could see the effects of the weather patterns had on the abiotic variables. I’ve learned more about the pond from doing these samples and the difference from the weather changes occurring during these days. Input = Drainage → Water collecting from the hockey rink → Flows underground and into the pond.
Data:
Screenshot from Google Sheets


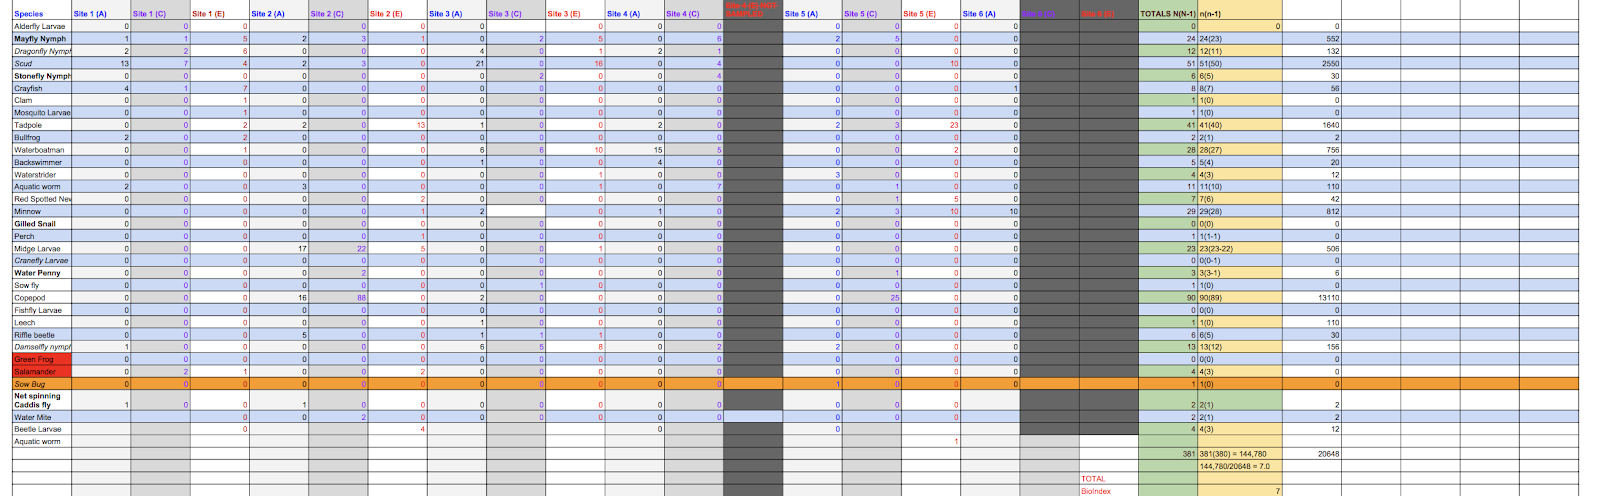
Screenshot from Google Sheets
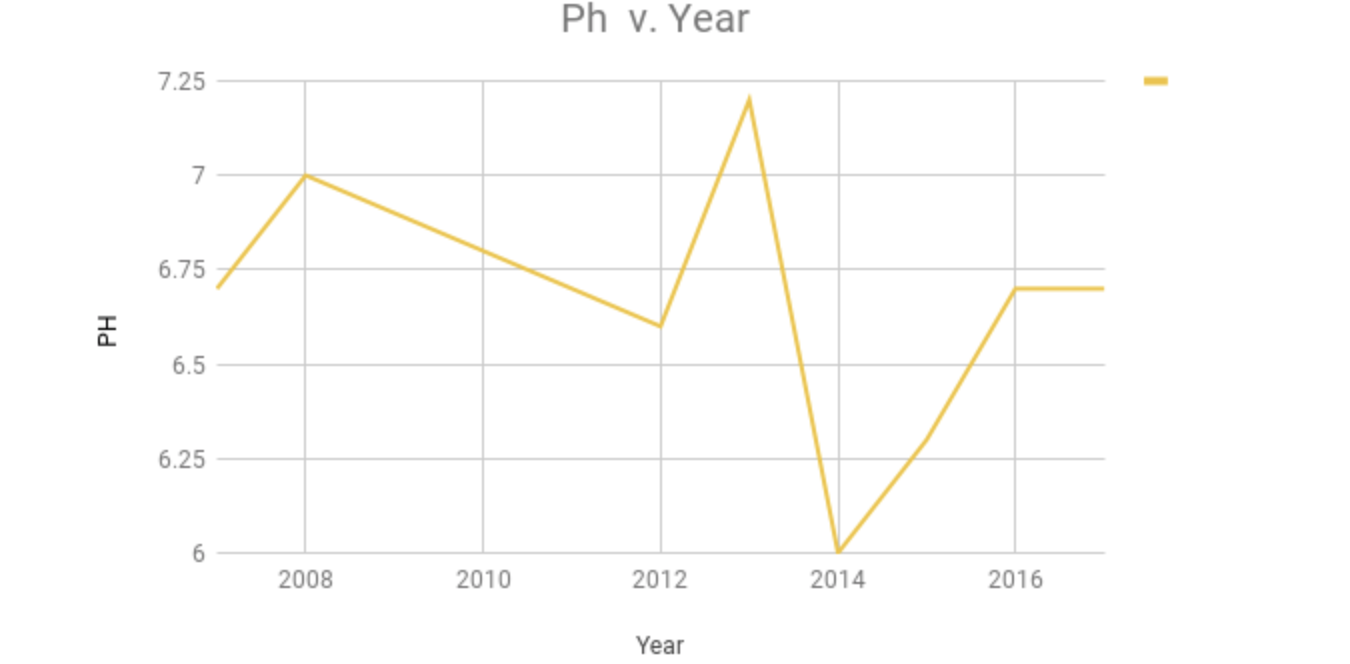

Screenshot credit Mo (ALL GRAPHS)

Screenshot credit Mo
 Sampson Biodiversity index
Screenshot from Google images
Analysis: Throughout the week of gathering information from the pond, I learned a lot about the ponds biodiversity. The data from the biotic samples hasn’t changed much but the abiotic data has varied throughout the years the APES classes have tested the pond. Since 2007 there has been a change in the Proctor pond. The lowest year with the lowest biodiversity index was 2009 with 0.74. This was because there was a huge freeze and only 12 species were recorded .There has also been an decrease in the index since 2012 when the turf fields were installed near site #2. This decreased to 7.26. The diversity index has been decreasing from years that the data has been recorded. In 2013 the index had a good increase of 12.2 but since then it has decreased and stayed at a consistent average. The diversity of the pond has been decreasing over the years. There were a lot of effects that caused this to happen and we can’t do anything about. We the humans could have made a mistake to this too. Our calculations could have been wrong or mistaken a different species for one we already found. The diversity index has increased this year. This fall hasn’t been to dry and over the last couple of days there has been some pretty heavy rainfall. The pond is a beautiful site and people don’t really know is in it. Doing these samples are good so we the students can regulate what is going on in the pond. Testing this once a year is needed to see the abiotic and biotic factors of the pond and we share this testing with the whole community.
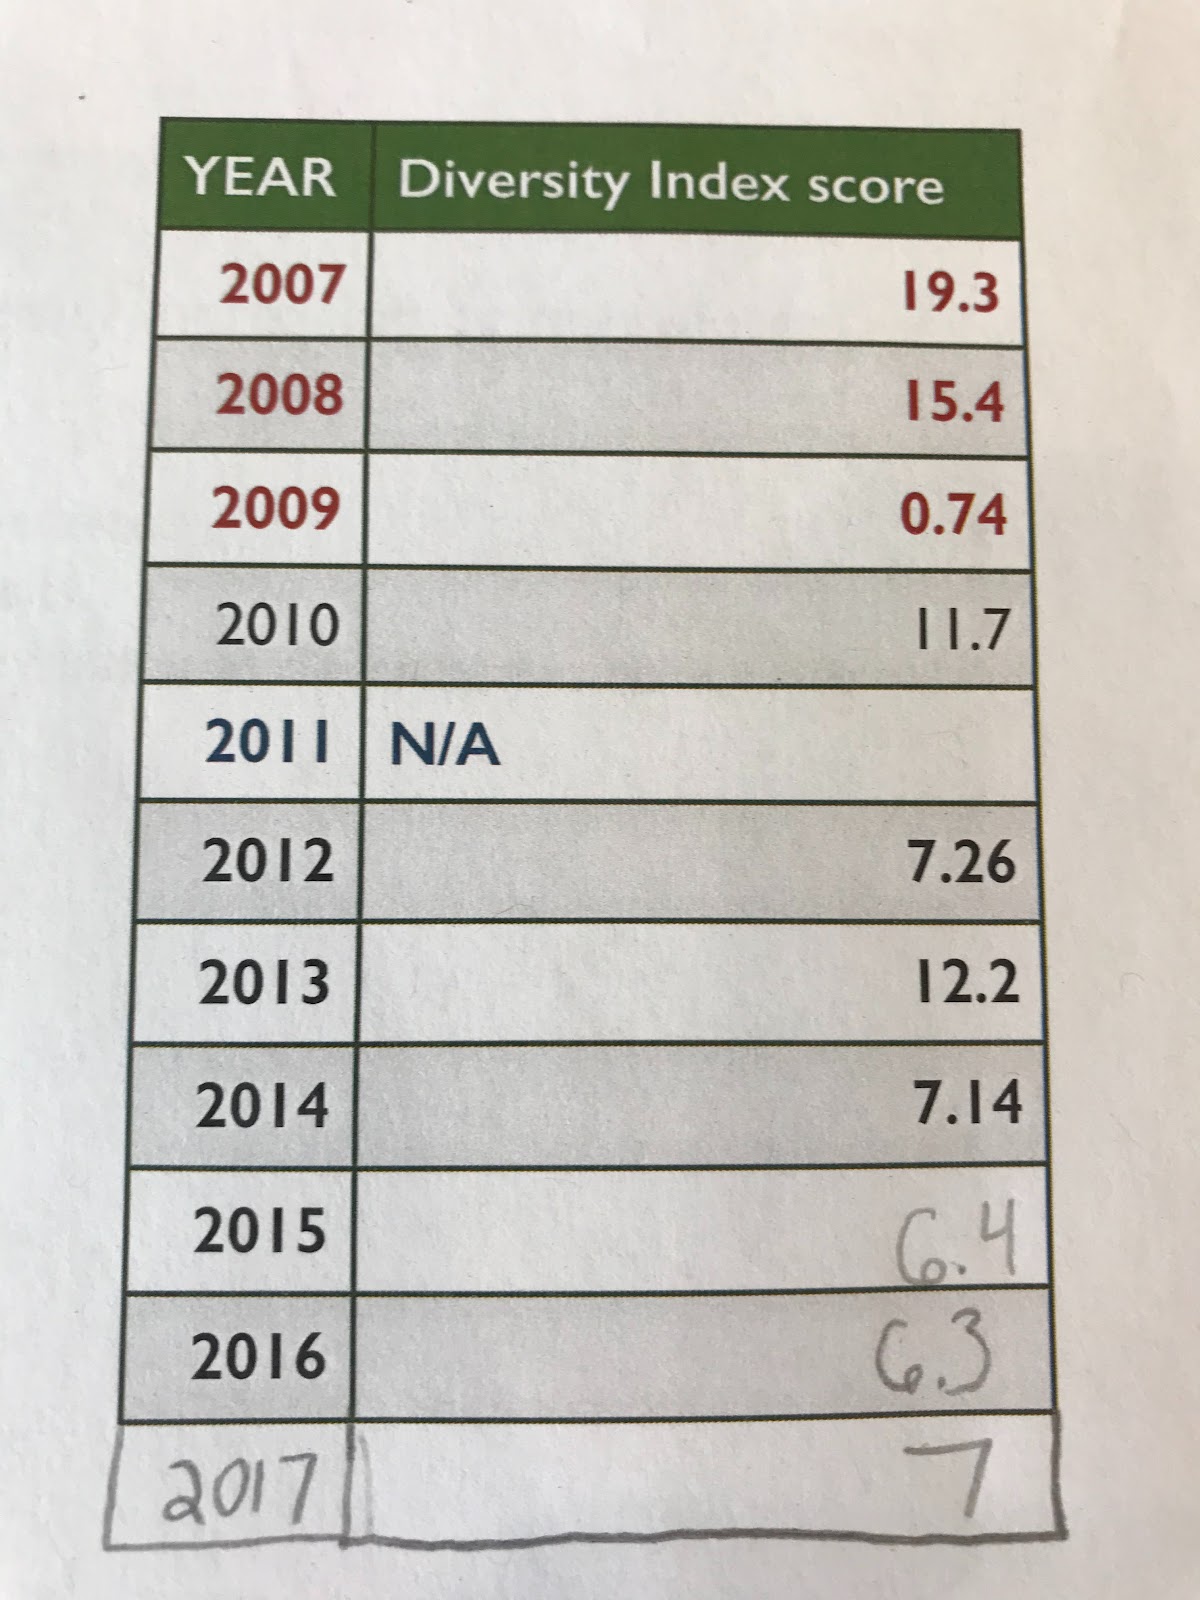
Photo credit Myles Abbate
Conclusion: From doing these testings on the Proctor Pond, The pond is healthy. The diversity of the pond is increasing slightly but those numbers could vary in the future years depending on the rainfall. The pond isn’t completely healthy but is doing better from the past couple of years. Looking at the diversity index (picture above) we can see the impacts on weather and changes in the proctor community affect this pond. The freeze on the pond in 2009 was the lowest the index has been and had a massive impact how students made test on the pond. Also, in 2012 the turf fields were installed near site #2. This definitely had an effect on how the runoff travels to the pond and the spread of the diversity. There was so much about the pond that I didn't know about. Everyday I walk by the pond and never think what’s in the pond or what’s the water like. There was a lot of biodiversity in the pond because of all the different creatures that we caught and saw in it. I think doing this kind of work is fascinating. Instead of learning this stuff in the classroom, we get a hands on learning and experience of all these things by ourselves. Experiencing these studies and tests in person gives me a better understanding of the material we learn in class.


Comments
Post a Comment